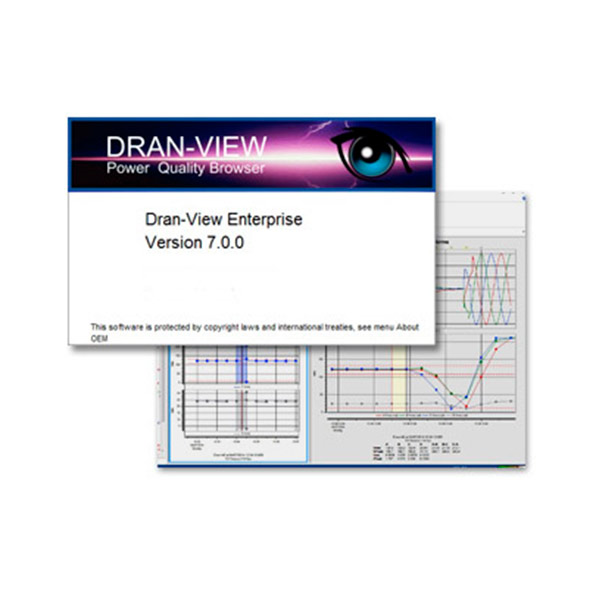
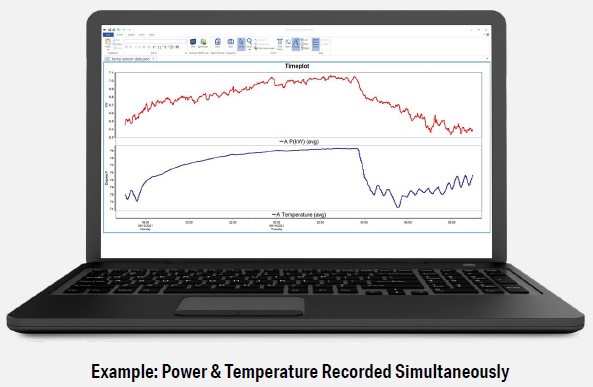
- A simple mouse click allows you to quickly scroll through data, zoom in on disturbances, trend data, filter events, evaluate statistics, and perform advanced harmonic and interharmonic analyses.
- The software has been optimized for speed and to accommodate large data sets.
- Flexibility has been integrated throughout the package—users can customize both appearance and behavior.
- Two versions are available—one for the everyday user (Pro), the second for advanced power professionals (Enterprise).
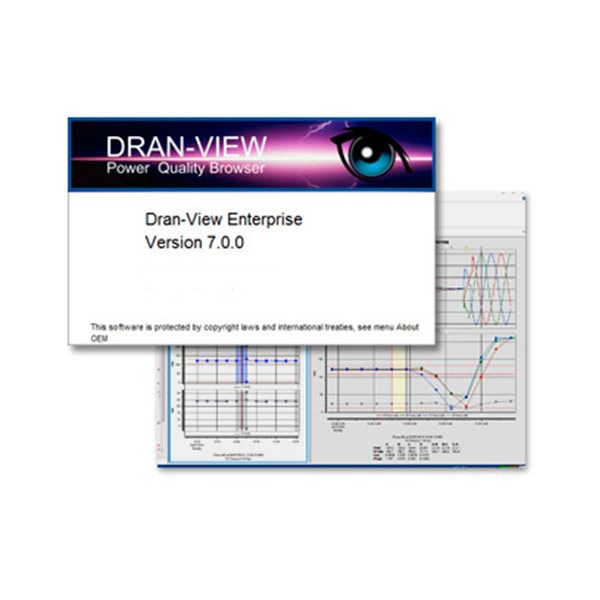
- Multi-functional Dran-View helps you make the most of complex data, so that you can spend time where it counts most—evaluating, troubleshooting and preventing power quality events.
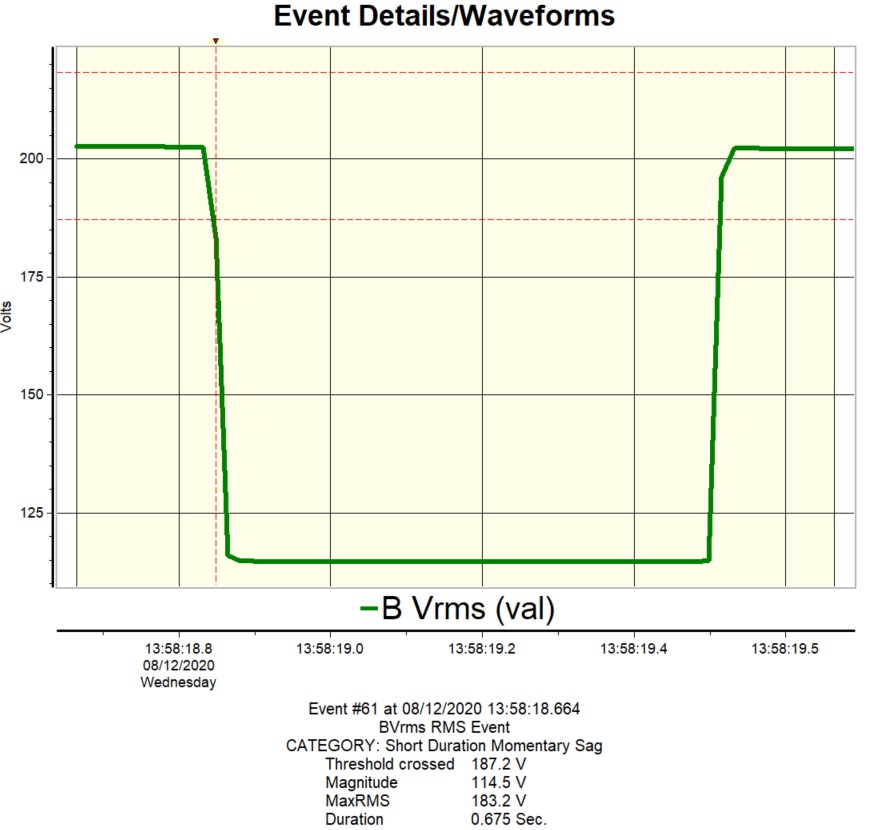
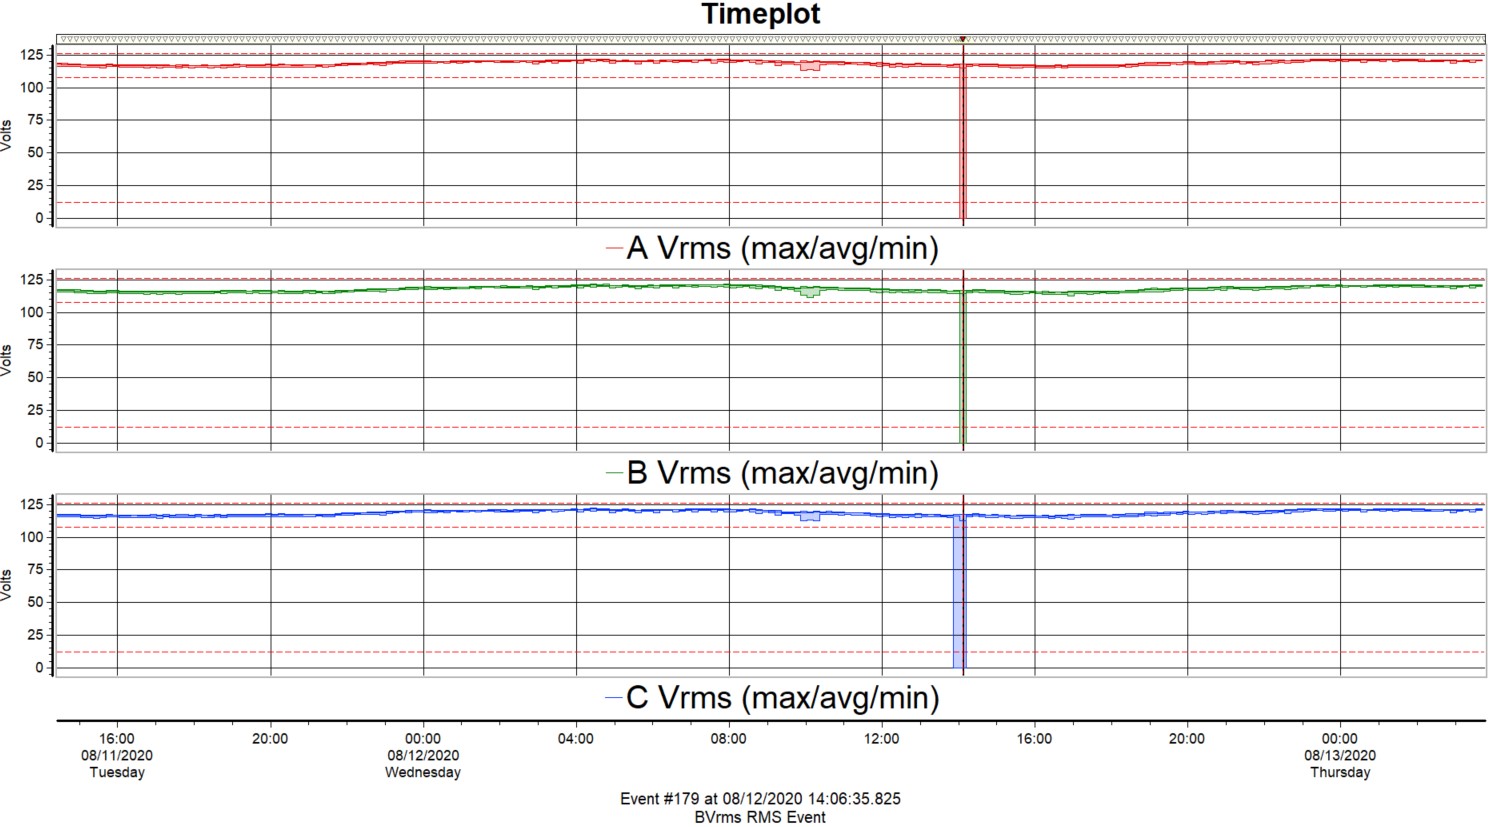
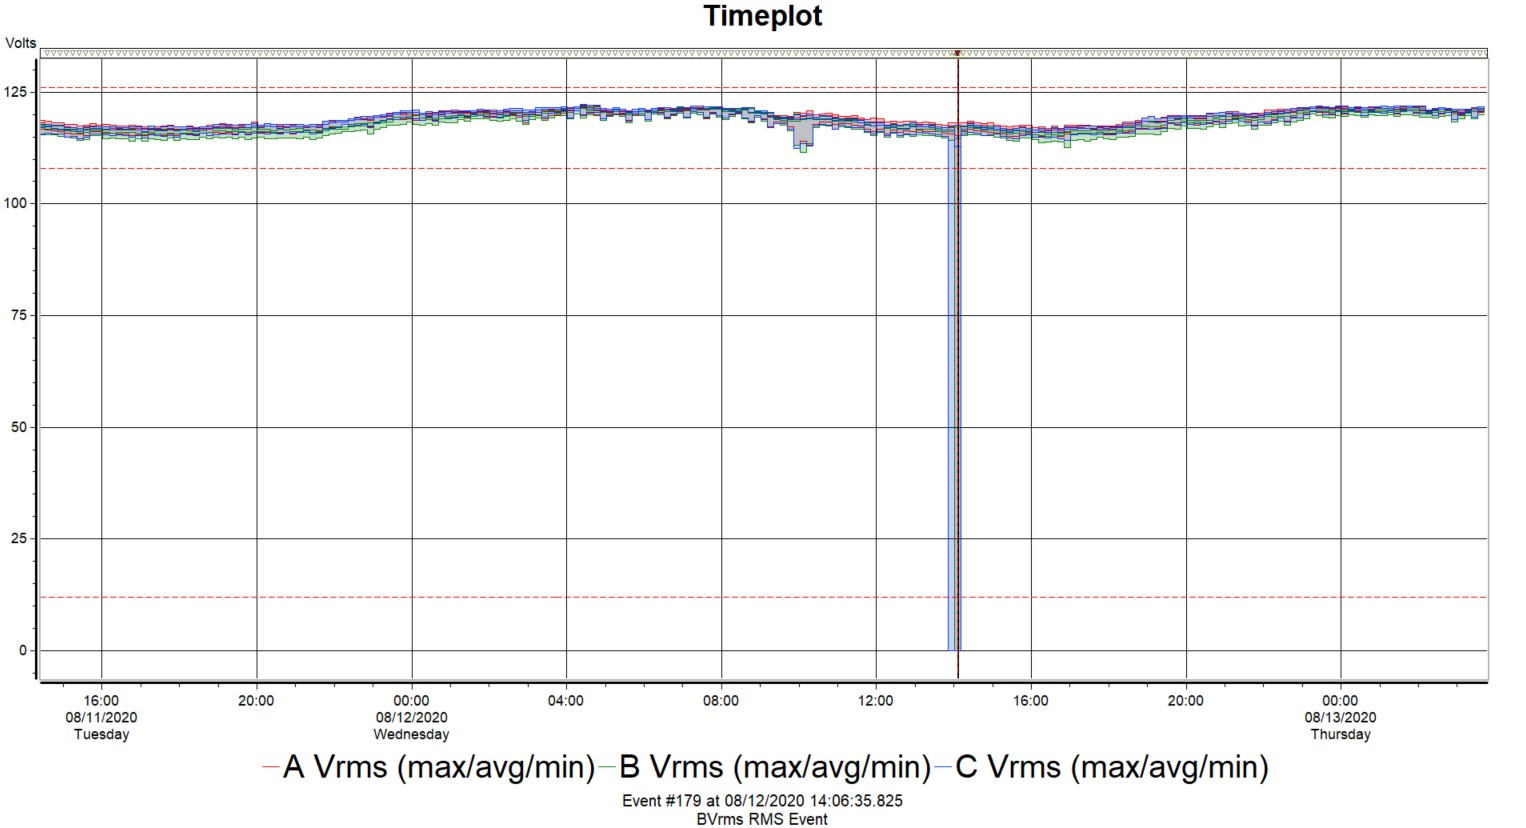
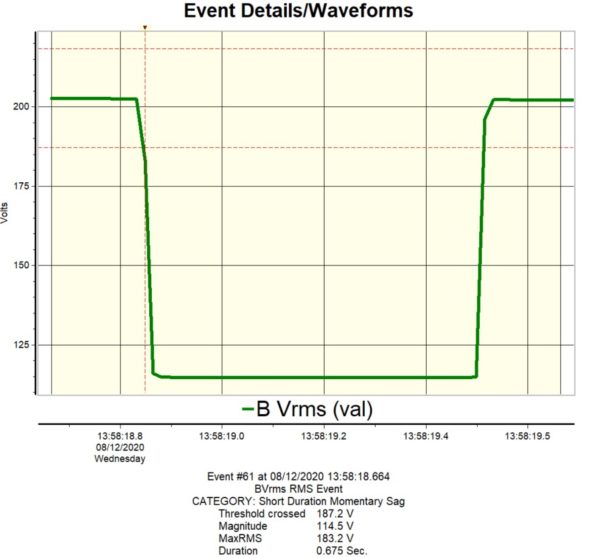
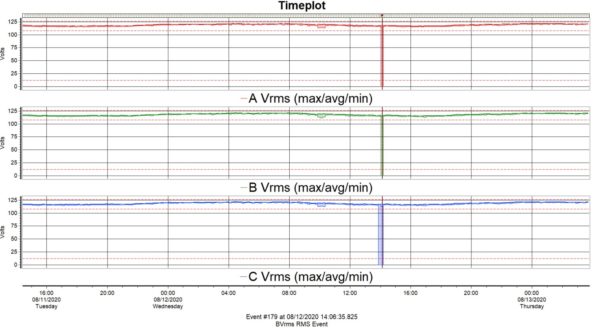
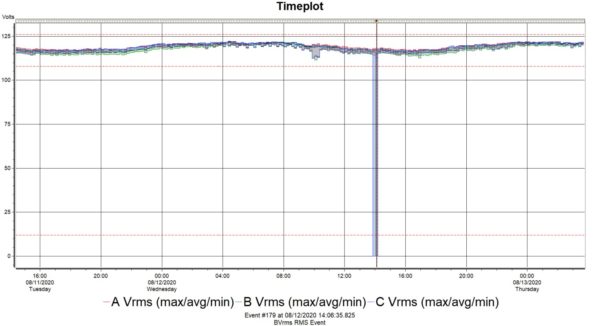
Detailed analysis of Power Quality and/or Energy data from nearly any recent products from Dranetz. These are not just screen captures, this is an advanced analysis of sample points recorded and saved by your Dranetz instrument, and presented in various forms including Time Plots, Event Lists, and Event detail. Due to the advanced design of the Dranetz event database Time Plots and Event Detail graphs can be zoomed in to get to the detailed information.
Communications – Direct communications with Dranetz HDPQ Plus and SP instruments.

Memory – Support for large data files.

New User Interface – Improved zoom and pan functions, drag and drop charts, insert pictures and photos, customize toolbars, and more.
Flexibility – Customizable report presentations and math functions in a wide variety of situations.
Undo/Redo – Has an unlimited Undo/Redo queue.
Built-in word processor – Features an internal word processor. Edit reports as they are generated, embed text documents within Dran-View files, and more.
Improved scaling of harmonics – Use separate harmonic scaling for voltage, current, and power parameters. For convenience, there’s only one setting across the document. Re-scales instrument as well as calculated harmonics.
Improved Format Templates – Format templates provide consistency in layout and format.
Web Updates – Automatic updates available via Internet.
Enhancements for the Enterprise edition only:
- Presentation of up to 16 simultaneous data sets emanating from different instrument models. This allows comparison of data from different sources in the same chart. Performs mathematical calculations across sites.
- Supports an unlimited number of presentation aides such as charts, statistical tables, and phasors in each window.
- Uses simple, intuitive drag-and-drop function to manipulate screen items.
- Supports a Harmonics/Timeplots Calculator for all file types resulting in more accurate harmonic calculations, more parameter calculations, etc.
- Allows fast and painless creation of print-queues or restore program states.
- Features an improved point-and-click formula editor.
- Reads IEEE C37.111-1991/1999 COMTRADE, IEEE 1159.3 PQDIF and TXT/CSV data files.
Operating System: Windows 10, 11
Processor: Pentium Pro or higher
Processor clock frequency: 1 GHz or higher recommended
Memory requirements: 2 Gb (4 Gb recommended)
Disk requirements: 100 MB for installation
USB Port: Interface required for HASP security device (DV7 Enterprise only)
Description | DV7 Professional | DV7 Enterprise |
---|---|---|
User Interface | ||
Scrollable (rubber band) chart axes | X | X |
Unlimited undo/Redo queue | X | X |
Diagrams: trend, waveform, magnitude/duration and DFT | X | X |
Chart area marking tool | X | X |
Format templates provides unified layout | X | X |
Event filtering/sorting | X | X |
Drag and drop charts, axes etc. | X | |
Insert pictures and photos | X | |
Floating notations (balloons) with user defined text or data | X | |
Customizable toolbars, keyboard shortcuts and menus | X | |
File and system features | ||
Support for large data files | X | X |
File compression (half size of original data) | X | X |
Automatic updates via Internet | X | X |
Compatible with Dran-View 6 | X | X |
Reads data from protection relays (COMTRADE files) | X | |
Reads tabulated text files | X | |
Remove partial data from measurement | X | |
Report Writing | ||
Basic report writer modules | X | X |
Monitoring mode specific reports | X | X |
Integrated text editor (RTF-editor) | X | X |
Snapshots / Bookmarks | X | |
Add selected events to report | X | |
Add selected trends to report | X | |
Reports against EN, IEC, G5/4, NVE standards | X | |
Multi-Site Report Writing | X | |
Multi-Site Capabilities | ||
Presentation of up to 16 simultaneous data sets | X | |
Multi-Site events filter (find events occurred at several locations) | X | |
Multi-Site time synchronization Mathematical comparisons between data sets (difference etc.) | X | |
Mathematical comparisons between data sets (difference etc.) | X | |
Rescue Kit (Data repair) |
||
Adjust timestamps | X | X |
Flip current probes | X | X |
Change scaling factors | X | X |
Change connection type | X | X |
Mathematical | ||
Calculate trends and harmonic parameters from waveform data (Inrush measurements for example) | X | |
Separate harmonic scaling for voltage, current and power | X | X |
Enhanced DFT features for selecting and analyzing harmonic spectra in the signal | X | |
Mathematical formulas (calculate leakage current etc) | X |