Consolidated Edison Company of New York is a long time user of Dranetz power quality monitoring systems and sister company Electrotek Concepts software and services. Dranetz Encore Series (61000) and Enhanced Power Quality, EPQ DataNodes) and legacy power quality instruments (8010 PQNode) are deployed throughout their network collecting needed data for PQ assessment. Electrotek’s PQView software, which is seamlessly integrated with the Encore System, provides database management, reporting and advanced statistical analysis. PQView’s Fault Analysis Modules identify and characterize faults, providing location information. Alarms are sent to operators who dispatch crews for repair, reducing the time to locate faults by hours.
The automatic distribution fault location system at the Consolidated Edison Company of New York was first put into use during the spring of 2005. It incorporates power quality monitors, microprocessor relays, database applications, up-to-date distribution circuit models, and geographic information system (GIS) databases in order to provide automatic distribution fault identification and fault location estimation. The system has become an indispensable tool for quickly and accurately identifying the location of faults in the Con Edison network distribution system.
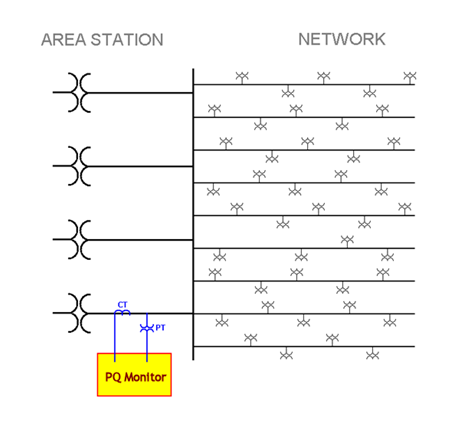
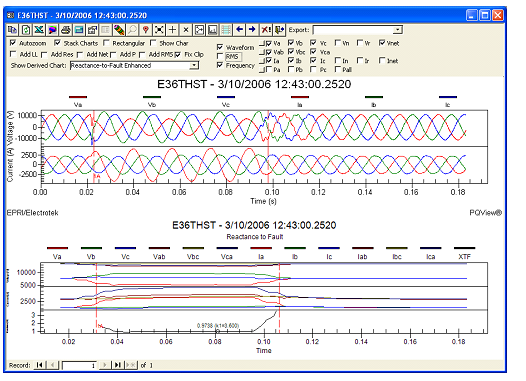
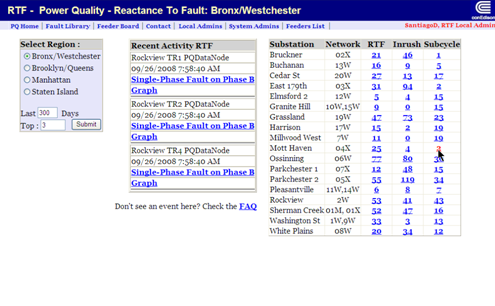
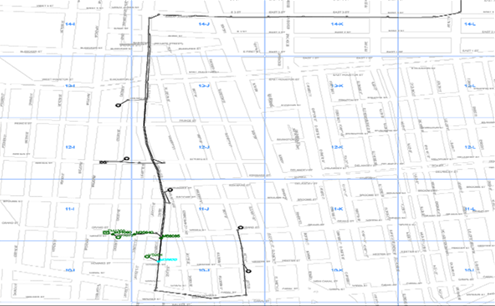
The fault location system uses measurements recorded by Encore Series PQ monitors located in distribution substations. These measurements are downloaded automatically by Encore Series Software which manages the power quality monitoring system. Fault data is automatically acquired by PQView software and stored in its relational database. Calculations on these measurements estimate the reactance from the substation to the fault. The calculations are based on phasor measurements derived from the voltage and current samples and calibration constants based on previous fault data and known locations. The result of these calculations is an estimated “reactance to fault,” or XTF. The XTF values are compared with feeder models that estimate the positive-sequence impedance between substation and feeder structures. The estimated locations can be viewed in tabular format on the corporate intranet and can be displayed graphically using maps derived from a GIS database. The estimations for fault location typically are available on the company intranet approximately ten minutes after the fault’s occurrence. The estimates are accurate to within 10% of the total number of feeder structures, for about 80% of the single-phase faults measured in the system.